G8JNJ
About
- Username
- G8JNJ
- Joined
- Visits
- 4,628
- Last Active
- Roles
- Member
- Points
- 127
Reactions
-
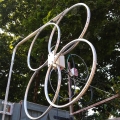
LZ1AQ LNA and a 1.2 meter copper loop antenna.
Hi Alain,
This circuit may help. It is placed on the KiWi RF input and rolls off the gain at MF and also incorporates a simple MF BC band notch.
The items marked 1 & 2 are the 50 Ohm input and output ports (treat them as coax connectors with a grounded screen). Component legs connected to a common ground are indicated with the triangular shaped three horizontal parallel bar symbols.
The basic circuit is a 10dB Tee attenuator formed by the three resistors.
The values chosen for the attenuator sets the maximum attenuation at the lowest frequency. You can increase or decrease the amount of attenuation by altering the value of the resistors. I chose 10dB as it seems to provide the best compromise in terms of optimizing the amplitude of signal levels VS S/N ratio when using typical antennas.
The 330pF capacitor and 330nH inductor set the frequency at which the attenuation starts to decrease.
The 100pF capacitor resonates with the 330nH inductor at around 30MHz to help reduce any residual attenuation at that frequency.
As the frequency increases the reactance of the capacitor decreases, and the reactance of the inductor increases and this gradually disconnects the attenuator network.
The circuit is typically used in cable TV networks to compensate for increasing coax attenuation with frequency. Amplifiers will have compensation to provide rising gain with frequency in order to offset the cable losses. If you want more background look up Zobel network
https://en.wikipedia.org/wiki/Zobel_network
On the output of the equaliser, a simple series tuned circuit notches out the MF signals centered on approx 900KHz with a notch depth of approx 25dB. The bandwidth and notch depth are determined by the component 'Q' and L/C ratio.
I have built quite a few for various KiWi owners. It usually solves the problem of MF band overload for folks who are using loops without unduly affecting the overall performance.
Regards,
Martin - G8JNJ -
LZ1AQ LNA and a 1.2 meter copper loop antenna.
Hi Alain,
This circuit may help. It is placed on the KiWi RF input and rolls off the gain at MF and also incorporates a simple MF BC band notch.
The items marked 1 & 2 are the 50 Ohm input and output ports (treat them as coax connectors with a grounded screen). Component legs connected to a common ground are indicated with the triangular shaped three horizontal parallel bar symbols.
The basic circuit is a 10dB Tee attenuator formed by the three resistors.
The values chosen for the attenuator sets the maximum attenuation at the lowest frequency. You can increase or decrease the amount of attenuation by altering the value of the resistors. I chose 10dB as it seems to provide the best compromise in terms of optimizing the amplitude of signal levels VS S/N ratio when using typical antennas.
The 330pF capacitor and 330nH inductor set the frequency at which the attenuation starts to decrease.
The 100pF capacitor resonates with the 330nH inductor at around 30MHz to help reduce any residual attenuation at that frequency.
As the frequency increases the reactance of the capacitor decreases, and the reactance of the inductor increases and this gradually disconnects the attenuator network.
The circuit is typically used in cable TV networks to compensate for increasing coax attenuation with frequency. Amplifiers will have compensation to provide rising gain with frequency in order to offset the cable losses. If you want more background look up Zobel network
https://en.wikipedia.org/wiki/Zobel_network
On the output of the equaliser, a simple series tuned circuit notches out the MF signals centered on approx 900KHz with a notch depth of approx 25dB. The bandwidth and notch depth are determined by the component 'Q' and L/C ratio.
I have built quite a few for various KiWi owners. It usually solves the problem of MF band overload for folks who are using loops without unduly affecting the overall performance.
Regards,
Martin - G8JNJ -
Passband filters HA8LFK
Hi Giulio,
Happy Christmas.
The switched band pass filter seems to be very similar to that found in many 1970 onwards Superhet design based Amateur radio transceivers, so I would expect that (as John has already stated) if you drive the switching diodes correctly, it would probably be adequate for the purpose.
However that may not be the best solution for use with the KiWi SDR.
I think we need to better understand the problem you are trying to solve before anybody makes any proper recommendations.
Can you provide a bit more background information ?
Regards,
Martin - G8JNJ -
Noise at roughly 60 KHz intervals
Interestingly I found that using screened CAT 5 cable actually made the noise levels on the VLF bands <50KHz much worse.
In the end I went back to using un-screened CAT 5 with 12 turns through a FT240-31 core (Mouser part number 623-2631803802) which was just as effective on the HF as it was when used with screened CAT 5 at frequencies around 20MHz, but didn't introduce the additional noise on VLF. I think the screen adds an additional ground loop, which the transformers in the Ethernet interface and external choke baluns can't fully isolate / filter because of the very low RF frequencies involved (just my opinion).
I also found that bonding the RF in and GPS connectors directly to the metal case at the point of entry reduced the HF noise floor by a further approx 3-6dB depending upon the exact cable configurations, but your mileage may vary.
Regards,
Martin - G8JNJ -
Virtual audio cable
Hi,
Just installed it and tried it but it doesn't work with the KiWi.
I tried playing some videos on YouTube and it worked OK with that.
So it can work but sadly not for the KiWi. Which is a pity as it would have been useful to open up receivers on different tabs, and then reroute the audio from each to separate destinations.
Regards,
Martin - G8JNJ -
Beagle Bone & KiWi grounding and ESD protection
This morning I checked the other Beagle that I had repaired as it previously had a blown PHY chip.
Guess what......
R136 has gone open circuit on this board too.
So the digital ground and ESD ground are no longer connected.
R136 had the correct value marking, so it's gone open circuit whilst in service.
I revisited the other board that still showed no connection between the digital and ESD grounds.
I removed R136 in order to try and check the PCB tracks, but they all seemed OK.
Then I replaced R136 again with a 0 Ohm resistor.
Now the digtial and ESD grounds show 0 Ohms between them.
So whatever was open circuit now seems to have recovered.
I suspect that it could have been the tiny through board vias that are right next to R136 under the RJ45 connector.
All is now good again with both previously faulty boards :-)
I have a couple of theories.
1. A nearby lightning surge had blown R136 open circuit at some point.
2. If a power supply with a grounded outer on the DC connector is in use, and the center pin of the 5v DC connector accidentally touches the metal can of the Ethernet, USB, SD card or metal mounting pillars (or metal case if mounted via the pillars). Then it may burn out R136 (and possibly some PCB track).
Either of the above (or something similar) will result in the loss of ESD protection (and possible failure of the Ethernet port) and RF screening.
Regards,
Martin - G8JNJ -
Seeed Metal case and GPIO connector
Hi All,
Just some brief notes regarding the installation of a 15 way D connector on the Seeed metal case in order to bring out the GPIO port for use with an antenna switch.
The ventilation slot cuts out very easily and only required a small amount of filing in order to make the connector shell fit.
First the pinout I used
End view of case
Top view of connector
Wiring to GPIO ports
Side view
Hope this is of some use to others.
Regards,
Martin - G8JNJ -
Seeed Metal case and GPIO connector
Hi All,
Just some brief notes regarding the installation of a 15 way D connector on the Seeed metal case in order to bring out the GPIO port for use with an antenna switch.
The ventilation slot cuts out very easily and only required a small amount of filing in order to make the connector shell fit.
First the pinout I used
End view of case
Top view of connector
Wiring to GPIO ports
Side view
Hope this is of some use to others.
Regards,
Martin - G8JNJ -
Kiwi not coming up after update (remote site) [fixed with software reload, root cause unknown]
Whilst messing about with my Broken Beagles I noticed that the DC volts at the power supply had to be at around 5.4V to provide 5v at the Beagle.
On first inspection this seems to be associated with the RF filter on the DC input of the KiWi board, which is causing a voltage drop to occur (before it is passed to the Beagle) when the KiWi is drawing it's approx 600mA average running current.
Further experimentation is required to find the optimum input voltage in order to ensure a clean start up.
I'd suggest checking the DC volts on the Beagle header when it's up and running, to see what's actually being applied to the board.
Regards,
Martin - G8JNJ


