
G8JNJ
About
- Username
- G8JNJ
- Joined
- Visits
- 4,028
- Last Active
- Roles
- Member
- Points
- 60
Reactions
-
Business survival and the ethics of Open Source
I'd also suggest emphasising the "works straight out of the box" aspect of the KiWi.
One competitor is making an attempt at this, so far unsuccessfully, but the majority of previous competitors have not been able to achieve this. Other options, such as OpenWebRX (moderate pain) or PhantomSDR/Plus software (really painful), are still in their infancy, and require a fairly extensive knowledge of Linux to get running initially, and then update and maintain.
Regards,
Martin

-
Business survival and the ethics of Open Source
This is a thorny subject, and I could write a thesis on it. I have already made my position clear to John, but I'll raise a few points here to further the discussion.
Open-source / FOSS is generally a great concept, kids these days like having stuff for free. Music streaming is perhaps one of the best examples. However, the problem is how to make money from it, and many small artists are still arguing about that one.
The principle of collaborative free software is good, as long as everyone contributes, less so when one person does the work, and everyone else sits back and makes use of it. In the workplace, most people know who is actually doing the bulk of the work, and who is just doing the bare minimum, or "clock watching".
John is in a difficult position, where the Opensource software, supports hardware, which he sells to make an income.
When you buy a KiWi you also get for free, a superb level of support from its enthusiastic developer (John), and unfortunately competing products like this, building on his work, but sold at low cost, for short term gain, will impact the long term survival of his business, including the other services he provides, such as TDoA, which run on his servers, at no additional cost to users.
By contrast, most of the previous KiWi clones have fallen by the wayside, despite assurances from the companies producing them, that they would not stop supporting their products. They try to make a quick "buck", then loose interest as sales decline.
The current competitors have used the KiWi code, and introduced some innovations in their own product, but these really only benefit the competing hardware, they do not directly feedback into the KiWi code, product or features. Their software is flaky, and response to significant bugs is usually patchy at best.
I don't think John can compete on the hardware side. Designing, building and selling hardware will always be difficult when competing against certain regions of the world. Low production costs, scale of manufacturing, circumventing import taxes and duties when shipped to other countries, and lack of respect for IPR, all add into the mix.
However, the time and effort he has put into developing the KiWi, since it's original fork from OpenWebRX, needs to be rewarded in some way, and I don't think that in future that can be achieved through the manufacture and sales of the hardware. Some way needs to be found to protect his IPR, provide a source of income, and cover the costs of him providing aftersales support, software updates, and the running costs of the services he provides for free such as TDoA and proxies etc. A subscription for support services, could be one way of achieving this, but in the meantime, protecting the parts of his code that he can, without infringing the Opensource parts, should definitely be considered.
Personally I'd risk doing this, and wait to see what happens, if someone objects then just fix the bit that is problematic, but in many cases it would be "the pot calling the kettle black", so I don't think it would be a major issue.
I'm all for respecting the law, and various formal or informal Open source agreements, however this shouldn't allow an individual to be taken advantage of, especially if they are good-natured and willing to go above and beyond what is required to make a profit, for the benefit of the community as a whole.
That is not fair, and should not be accepted by anyone with a social conscience, or sense of justice.
I could say an awful lot more, but this summarises my position, and I hope it will lead to a more meaningful debate.
Regards,
Martin


-
Wonder what this is at 5300Khz? - its always there.
Hi Philippe,
That looks like a switching supply to me, probably more than one.
See if the bands of interference repeat at regular intervals, typically at harmonics of the actual switching frequency, 60, 100, 160kHz.
Unfortunately, if carried by the mains supply they are connected to, the radiated noise can be propagated over a large area, and you will find peaks and troughs in the radiation pattern, depending on the length of wire that are attached to.
I have recently been trying to locate some broadband VDSL interference centred on 3MHz, that is emanating from houses at least 0.5km away from the KiWi site, but fed with overhead copper phone lines.
I've been using SDR Angel and its "heat mapping" option, to perform "drive by" surveys of the area.
I use a magnetic mount active whip and GPS antennas, connected to an RTL SDR V4 dongle and laptop.
The more orange / red or brighter the "blob" plotted on the map, the stronger the signal level.

The KiWi probably has most of the required hardware to be able to do this, but KiWi recorder may be more suited.
Regards,
Martin

-
Wonder what this is at 5300Khz? - its always there.
For transmit purposes, it's all about antenna efficiency, and radiating as much of the applied RF power in the direction you want it to go.
For reception purposes, it's all about the Signal to Noise Ratio, and a good transmit antenna may not always be a good receive antenna.
The natural noise floor on the LF bands is relatively high, especially in urban areas, and even quite small antennas can still be performance limited by the surrounding noise floor.
Rather than concentrating on large antennas, you may get better results with a smaller antenna in an electrically quieter location. Some experimentation is required, to get the best results.
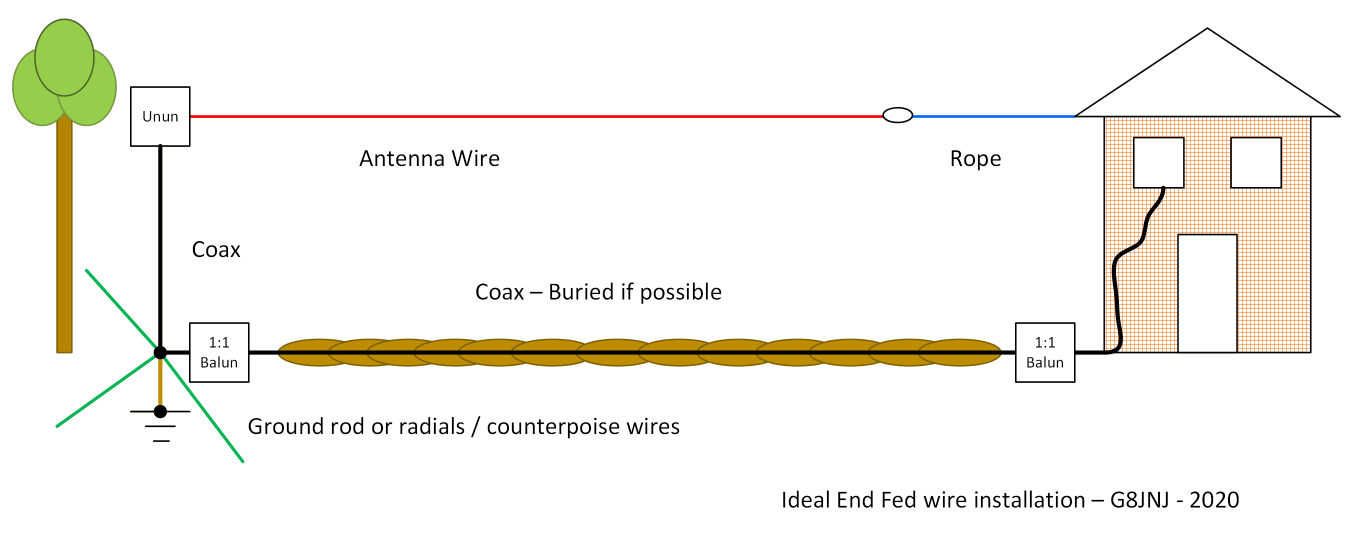
Balanced antennas are generally better than unbalanced ones, and end fed wires have a reputation as being noise magnets.
If you do wish to install one, this diagram may provide some suggestions about minimising unwanted noise.
Regards,
Martin

-
Please protect your KiwiSDR 2 from the high-level RF fields of nearby transmitters
Each of the DXE filters contains two filtered Halo HFJ-1G46ERL RJ45 sockets wired back to back on a small PCB.
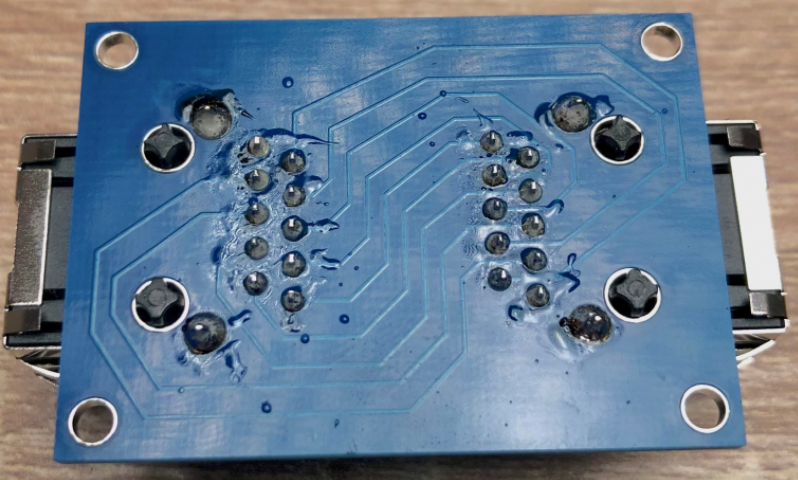
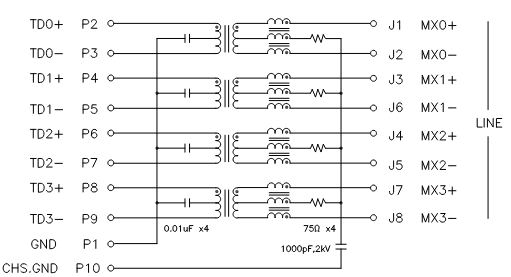
Pin 10 seems to be left floating in the DXE design.
Regards,
Martin