Solar interference

Hi All,
Here's an alternative form of solar interference.
Screen grab of waterfall from my Wessex (ahem) KiWi web sdr showing spectrum from 0-60MHz earlier this afternoon.
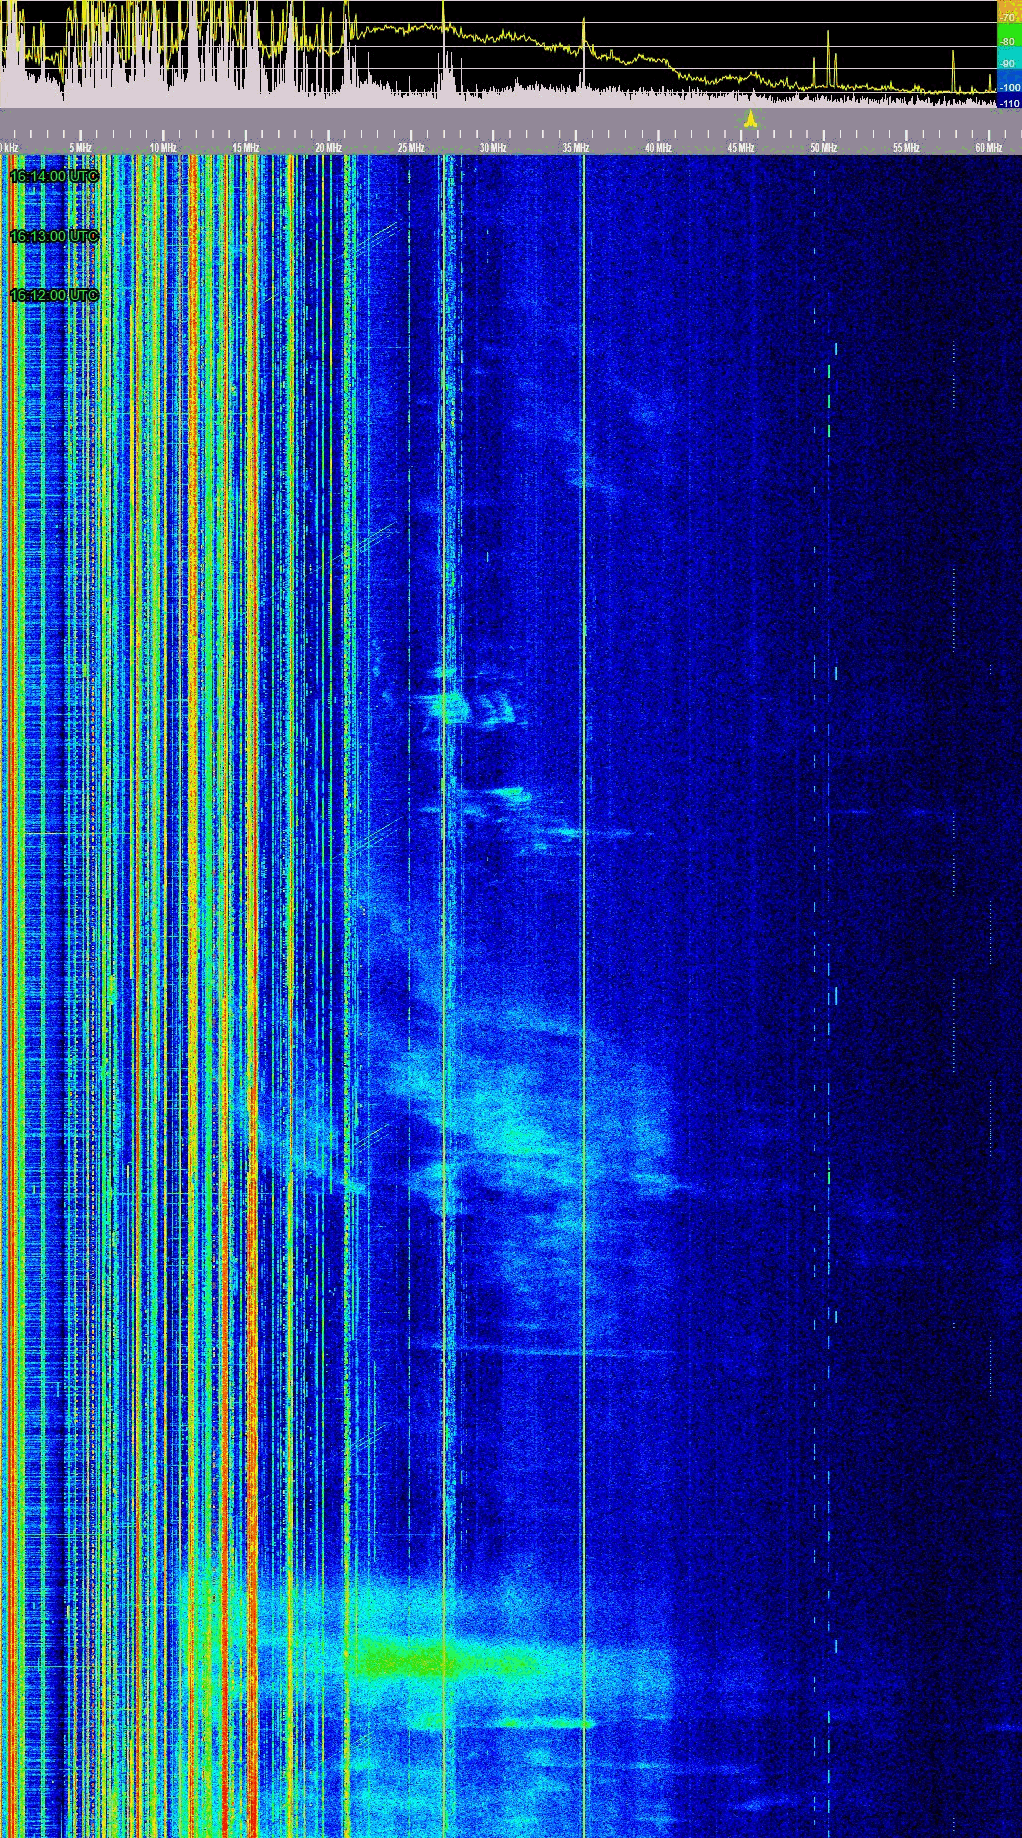
There was much more severe burst of noise before I started the waterfall rolling, you can see this from the yellow peak hold line on the spectrum display at the top of the image.
I hastily added some time markers towards the top of the grab when I realised it wasn't a more usual fleeting solar event.
Looks like it was a genuine event, and not just local interference such as precipitation static, which sometimes occurs.
"Space Weather Message Code: ALTTP2
Serial Number: 1230
Issue Time: 2023 Jul 28 1627 UTC
ALERT: Type II Radio Emission
Begin Time: 2023 Jul 28 1552 UTC
Estimated Velocity: 550 km/s
NOAA Space Weather Scale descriptions can be found at
www.swpc.noaa.gov/noaa-scales-explanation
Description: Type II emissions occur in association with eruptions on the sun and typically indicate a coronal mass ejection is associated with a flare event."
Anyone else see this ?
Regards,
Martin
Comments
(ahem) ... 0-60MHz
Any port in a storm! lol. Beautiful image.
there's been both elevated X-Ray flare and Proton Flux levels. The latter hasn't been occurring as often as the X-flares. Both are bad!
That's a beautiful spectrum of type II and III emissions Martin.
I see solar radio emissions too, but unfortunately i have a lot of PLC noise above 15 MHz, so it doesn't look as great as in your spectrogram.
I'm actively following solar activity for 20 years, and solar radio bursts are often the first thing i notice of a solar eruption, even before the GOES x-ray data arrives (they have a few minutes delay).
The kiwi is great for that.
Here you can see a shortwave fadeout from a M4 flare, right after a type III burst.
"Any port in a storm! lol. Beautiful image."
Surely - Any port in a Solar storm :-)
A few more type II this morning.
Here's a nice faster waterfall capture with drift and strong second harmonic.
I have seen sort duration HF faded outs, sometimes without obvious solar bursts.
There is one very slight solar fadeout in the previous screen grab, most noticeable on the continuous signal around 12MHz.
Fascinating stuff.
Regards,
Martin
What's your antenna Martin?
It's also interesting to compare the own plots with the e-callisto solar spectrometers:
http://soleil.i4ds.ch/solarradio/callistoQuicklooks/
The antenna is a 20m per side terminated vertical delta loop fed at the apex approx 20m agl running South West / North East.
It is on a hilltop site in a rural area, overlooking the Southern coast of the UK.
http://wessex.zapto.org:8073 - 0-30MHz KiWi
http://wessex.zapto.org:8075 - 0-60MHz KiWi'esk RaspSDR running Flydog SW (sorry John)
I have found one of the plots on the site you mentioned to be a very good match with my observations, so I'll keep that URL in mind for future reference.
http://soleil.i4ds.ch/solarradio/qkl/2023/07/29/AUSTRIA-OE3FLB_20230729_084503_57.fit.gz.png
Thanks again,
Martin
perhaps worth a look
Interesting.
Unless I'm mistaken all the animated plots seem to start at 09:50. Which is a about an hour after the event in my last image.
There have been several other events during the day but none quite as spectacular.
Regards,
Martin
all the raw data for "years" is available on that site if you would like to see how it aligns. It takes some digging!
this is one of the places
https://services.swpc.noaa.gov/json/goes/primary/xray-flares-latest.json
Although not all flares come with radio emissions, and not all radio emissions are due to flares.
For example, solar jets often produce intense type III bursts, but they cause almost no x-ray emissions.
Radio emissions are produced when a coronal mass ejection is interacting with the corona. While it pushes from the dense to the thinner part of the corona, the emmited frequency gets lower (type II emission) and from the rate of the frequency drift, the speed of the coronal mass ejection can be derived (That's how the "Estimated Velocity" parameter in Martin's first post is calculated).
In the last few days, a Solar energetic particle (SEP) event seems to have more impact on HF than the X-Ray flares. The X-rays get here in about 8 minutes 20 secs, The fastest particles may acheive 80% of that speed.
X-Ray events are rather transient. The SEP seem to linger for days.
The currently ongoing >X3 flare just wiped out almost my entire spectrum:
My data is only as good as the official sources provide and effects of the internet... but here's something I put together.. I'm more concerned about the proton event which can last days..
"http://www.jimlill.com:8088/muf/ezsun.html"
Today (April 19) there have been dozens of solar bursts covering about 6 to 30 megs visible on my KIWI... here's one:
The Sun has been very busy all afternoon, with typically one or two bursts every few minutes.
Here's a big one lasting about 20 seconds, and covering from 20 to >60MHz, with the signal level peaking 30dB above the noise floor at around 35MHz.
Plenty of associated Geomagnetic activity.
http://www.geomag.bgs.ac.uk/education/current_activity.html
Regards,
Martin
Beautiful captures of Type-III emissions!
Looks like there was a CME causing a M1 & Kp7 / G3 event.
More unsettled space weather is predicted for the next few days.
A few occasional noise bursts today, but nothing like yesterday.
Regards,
Martin