
G8JNJ
About
- Username
- G8JNJ
- Joined
- Visits
- 3,361
- Last Active
- Roles
- Member
- Points
- 400
Reactions
-
FAX - CHA Canada 4414KHz
New FAX frequency for me last night that doesn't seem to be listed.
UPDATE
It's Sydney (VCO) Canada and it's in the FAX Extension list I just missed it.
Fax schedule:
1121 UTC 4416 kHz Ice analysis - Gulf of St Lawrence
1142 UTC 4416 kHz Ice Analysis East or SouthEast Newfoundlandwaters
1741 UTC 4416 kHz Ice analysis - Iceberg limit
2200 UTC 6915 kHz Ice analysis - Gulf of St. Lawrence
2331 UTC 6915 kHz Ice analysis East or SouthEast Newfoundlandwaters
Showing an ice chart for area around the Gulf of St Lawrence
Plus another odd one logged back in November, that I can't remember if I mentioned before.
GYA, 120Line Surface Prognosis chart 8083KHz USB FAX - TDoA possibly Inskip UK
Regards,
Martin - G8JNJ
-
Open WEB RX enhancements
Some interesting enhancements to OpenWeb RX by Jakob, DD5JFK which he seems to have forked from the original work by Andr?s, HA7ILM.
https://github.com/jketterl/openwebrx/blob/develop/README.md
Apart from the addition of wsjt-x based demodulators for FT8, FT4, WSPR, JT65, JT9
He's also added Clientside bookmarks (DX Labels or Tags) which every user can store for themselves in the browser's localStorage.
Interesting stuff.
Regards,
Martin - G8JNJ

-
Open WEB RX enhancements
Some interesting enhancements to OpenWeb RX by Jakob, DD5JFK which he seems to have forked from the original work by Andr?s, HA7ILM.
https://github.com/jketterl/openwebrx/blob/develop/README.md
Apart from the addition of wsjt-x based demodulators for FT8, FT4, WSPR, JT65, JT9
He's also added Clientside bookmarks (DX Labels or Tags) which every user can store for themselves in the browser's localStorage.
Interesting stuff.
Regards,
Martin - G8JNJ -
Using WSPR data to compare antennas
Hi All,
Based on Stu's comments in another thread
>
>If you did make a database one thing I'd really like is the ability to run two or more systems and break down which works better on a band.
>
I thought it may be useful to outline he processes I use to make antenna measurements with WSPR and other similar methods that make use of KiWi web sdr's.
First using WSPR.
WSPR does not report received signal level, but the signal to noise ratio of an individual WSPR transmission as received at the reporting station.
Individual reporting stations will have differing S/N ratios, depending upon the location, antenna, receiver and frequency in use. They also have different propagation paths from the transmitting station.
Therefore you can only compare 'like with like' and derive a delta, not an absolute value.
In order to be able to do this a minimum of two stations are required, which can either be two (or more) transmitting stations as received by one reporting station e.g. one transmit location with two separate antennas and transmitters, or one transmitting station as received by two (or more) reporting stations e.g. one receive location with two separate antennas and receivers.
To be valid data points, the sets of reports being analysed have to be contained within the same two minute time window as each other.
In order to minimise 'outlying' data points it's good practice to be able to exclude S/N values that are outside certain limits. e.g above +10dB as many receive systems compress above this value and also below -25dB as random noise badly distorts the reported value when it becomes closer to the system detection threshold of around -30dB.
WSPR only reports in 1dB steps, so this limits the absolute accuracy that can be obtained. However it is possible to interpolate by using methods such as curve fitting. e.g. plot the distribution of spots for one transmission as received by one reporter. These could be visualised as a horizontal axis of S/N values with 35 vertical bars representing -25dB to +10dB and the vertical axis representing the number of spots of that particular value were reported. If a curve is then 'fitted' to the distribution of the bars, and the peak of the curve is found on the horizontal axis, then the averaged value to sub dB accuracy can be derived.
This is why I like to transmit at 100% duty cycle, as I have often noticed that some spotting stations have a cyclic variation in reported S/N values, when another local WSPR station transmits during one of the receive time slots and either de-sensitises the receiver or operates the receiver AGC, both of which produce a variation in the reported S/N ratio during that time slot. This can be seen as two or more distinct peaks in the distribution curve. In which case either the complete data set can be discarded or the lower sets of values ignored, although this will still slew the results slightly, and should only be used if you are really desperate.
If the curve is not very precise or flat, then either there are not enough spots, or there is too much variation in S/N values and the data sets should be discarded.
The derived S/N values can then be compared against each other and another delta bar graph histogram can be produced and curve plotted to derive a final result.
If this process is repeated for a number of time slots, sets of stations and different bearings, it is possible to produce a polar plot scattergram, showing the differences between two (or more) different antennas.
However as you can imagine all of this is very time consuming to perform manually and it is just crying out for some sort of automated process to be implemented. Something like the WSPRLite system which is a subscription service.
https://www.dxplorer.net/wsprlite/
The sequence I follow to measure the delta between two transmit antennas is as follows:-
Setup two transmitters with different callsigns, each one on a different antenna.
I usually use a vertical 1/4 wave as the 'reference' antenna, as this is omni-directional and easy to model. The other antenna and transmitter is the one 'under test'.
Transmit on one band for 1 hour at 100% ratio, so that I can quickly collect lots of spots, in all the time slots, before the propagation changes too significantly to distort the results.
It's best to do this mid morning or mid afternoon so that grey line and other relatively rapid propagation changes are not occurring.
Collect the hours worth of spots from WSPRNET, discard any reports above +10dB or below -25dB, match signals into the same time slots, discard any sets of signals that do not have a full set of reports in each time slot e.g. only one station reported.
Plot distribution bargraph and curve fit to find average S/N value for each station and reporter pair.
Compare average S/N value for transmitter 1 and transmitter 2 and calculate difference. If there are many reporting stations, plot distribution bargraph of delta S/N values and curve fit to find sub dB average value for each reporting 'pair'.
Use bearing information to produce polar plot scattergram, showing differences in radiation pattern.
The process of comparing two receive antennas is very similar, just substitute the word receiver for transmitter in the above example.
I also use a similar process by comparing signal strengths, but I have to do this manually by comparing KiWi signal strength graphs whilst monitoring plain carriers from two transmitters, if comparing transmit antennas, or AM broadcast stations, if comparing receive antennas.
I usually plot these consecutively over a 2 minute period and note the maximum signal level during that period. This has to be done by 'eyeballing' the graph, which is not as accurate as would be desired as the scaling is in 10dB intervals and it's not currently possible to download the data for off-line analysis in the form of a .csv or .txt file. Although it may be possible to use kiwirecorder.py to perform this function. Once again the manual analysis is very laborious and time consuming.
I hope this provides some 'food for thought' and that it would be possible to provide an alternative to the WSPRNET database which is creaking under the strain, and in addition be able to provide more useful on-line analysis tools that would be of great benefit to the community.
Regards,
Martin - G8JNJ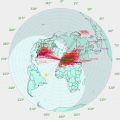
-
Using WSPR data to compare antennas
Hi All,
Based on Stu's comments in another thread
>
>If you did make a database one thing I'd really like is the ability to run two or more systems and break down which works better on a band.
>
I thought it may be useful to outline he processes I use to make antenna measurements with WSPR and other similar methods that make use of KiWi web sdr's.
First using WSPR.
WSPR does not report received signal level, but the signal to noise ratio of an individual WSPR transmission as received at the reporting station.
Individual reporting stations will have differing S/N ratios, depending upon the location, antenna, receiver and frequency in use. They also have different propagation paths from the transmitting station.
Therefore you can only compare 'like with like' and derive a delta, not an absolute value.
In order to be able to do this a minimum of two stations are required, which can either be two (or more) transmitting stations as received by one reporting station e.g. one transmit location with two separate antennas and transmitters, or one transmitting station as received by two (or more) reporting stations e.g. one receive location with two separate antennas and receivers.
To be valid data points, the sets of reports being analysed have to be contained within the same two minute time window as each other.
In order to minimise 'outlying' data points it's good practice to be able to exclude S/N values that are outside certain limits. e.g above +10dB as many receive systems compress above this value and also below -25dB as random noise badly distorts the reported value when it becomes closer to the system detection threshold of around -30dB.
WSPR only reports in 1dB steps, so this limits the absolute accuracy that can be obtained. However it is possible to interpolate by using methods such as curve fitting. e.g. plot the distribution of spots for one transmission as received by one reporter. These could be visualised as a horizontal axis of S/N values with 35 vertical bars representing -25dB to +10dB and the vertical axis representing the number of spots of that particular value were reported. If a curve is then 'fitted' to the distribution of the bars, and the peak of the curve is found on the horizontal axis, then the averaged value to sub dB accuracy can be derived.
This is why I like to transmit at 100% duty cycle, as I have often noticed that some spotting stations have a cyclic variation in reported S/N values, when another local WSPR station transmits during one of the receive time slots and either de-sensitises the receiver or operates the receiver AGC, both of which produce a variation in the reported S/N ratio during that time slot. This can be seen as two or more distinct peaks in the distribution curve. In which case either the complete data set can be discarded or the lower sets of values ignored, although this will still slew the results slightly, and should only be used if you are really desperate.
If the curve is not very precise or flat, then either there are not enough spots, or there is too much variation in S/N values and the data sets should be discarded.
The derived S/N values can then be compared against each other and another delta bar graph histogram can be produced and curve plotted to derive a final result.
If this process is repeated for a number of time slots, sets of stations and different bearings, it is possible to produce a polar plot scattergram, showing the differences between two (or more) different antennas.
However as you can imagine all of this is very time consuming to perform manually and it is just crying out for some sort of automated process to be implemented. Something like the WSPRLite system which is a subscription service.
https://www.dxplorer.net/wsprlite/
The sequence I follow to measure the delta between two transmit antennas is as follows:-
Setup two transmitters with different callsigns, each one on a different antenna.
I usually use a vertical 1/4 wave as the 'reference' antenna, as this is omni-directional and easy to model. The other antenna and transmitter is the one 'under test'.
Transmit on one band for 1 hour at 100% ratio, so that I can quickly collect lots of spots, in all the time slots, before the propagation changes too significantly to distort the results.
It's best to do this mid morning or mid afternoon so that grey line and other relatively rapid propagation changes are not occurring.
Collect the hours worth of spots from WSPRNET, discard any reports above +10dB or below -25dB, match signals into the same time slots, discard any sets of signals that do not have a full set of reports in each time slot e.g. only one station reported.
Plot distribution bargraph and curve fit to find average S/N value for each station and reporter pair.
Compare average S/N value for transmitter 1 and transmitter 2 and calculate difference. If there are many reporting stations, plot distribution bargraph of delta S/N values and curve fit to find sub dB average value for each reporting 'pair'.
Use bearing information to produce polar plot scattergram, showing differences in radiation pattern.
The process of comparing two receive antennas is very similar, just substitute the word receiver for transmitter in the above example.
I also use a similar process by comparing signal strengths, but I have to do this manually by comparing KiWi signal strength graphs whilst monitoring plain carriers from two transmitters, if comparing transmit antennas, or AM broadcast stations, if comparing receive antennas.
I usually plot these consecutively over a 2 minute period and note the maximum signal level during that period. This has to be done by 'eyeballing' the graph, which is not as accurate as would be desired as the scaling is in 10dB intervals and it's not currently possible to download the data for off-line analysis in the form of a .csv or .txt file. Although it may be possible to use kiwirecorder.py to perform this function. Once again the manual analysis is very laborious and time consuming.
I hope this provides some 'food for thought' and that it would be possible to provide an alternative to the WSPRNET database which is creaking under the strain, and in addition be able to provide more useful on-line analysis tools that would be of great benefit to the community.
Regards,
Martin - G8JNJ -
new ADC overflow logic (S-meter "OV" indicator) [added in v1.315, improved in v1.357,358]
Hi Jim,
>
>Wasn't extension locking added recently
>
Yes it was, but the dev extension is not listed among the rest on the extension admin page, so you can't lock it out from general users.
Regards,
Martin - G8JNJ -
Syllabic Voice Squelch
Hi All,
Over on Simon Brown's SDR radio IO Group, he's just mentioned the Voice Activity Detection (VAD) component of Rnnoise, and thinks that it may be worthy of further investigation.
https://people.xiph.org/~jm/demo/rnnoise/
It's written in C and is available under a BSD license, and uses Recurrent neural networks (RNN) to provide voice detection and noise suppression.
Regards,
Martin - G8JNJ -
Antenna recommendation for listening to faraway DRM broadcast inside a city
HI,
It's possible to use an external 12v supply.
However adding a 1000uF 16v electrolytic across the secondary of the big common mode choke in the "Biasing Tee" removes just about all of the unwanted noise around 60 & 120KHz emanating from the DC-DC switcher.
I think it was an oversight on their part to not include something like this.
Regards,
Martin - G8JNJ